Table of Contents
Unit 1 | Algebra
Page 1 | Expressions and Formulae
Page 3| Solving Linear Equations
Page 4| Expanding and Factorising
Page 5| Factorising Quadratics and expanding double brackets
Page 6| Patterns and Sequences
Page 7| Simultaneous Equations
Page 8| Changing the subject of a Formula
Page 9| Adding , subtracting algebraic formulas
Unit 2 |Graphs
Page 1 | Straight line graphs
Page 2 | Graphs of Quadratic functions
Unit 3 |Geometry and Measure
Page 2 | Symmetry
Page 3 | Coordinates
Page 4 | Perimeter, Area, Volume
Page 6 | Measurement
Page 7 | Trigonometry
Page 8 | Pythagoras
Page 9 | Angles
Page 10 | Shapes
Page 11| Time
Page 12 | Locus
Unit 4 | Numbers
Page 1 | Speed, Distance and time
Page 2 | Rounding and estimating
Page 3 | Ratio and proportion
Page 4 | Factors, Multiples and primes
Page 5 | Powers and roots
Page 7 | Positive and negative numbers
Page 8 | Basic operations
Page 9 | Fractions
Page 10 | Percentages
Unit 5 | Statistics and Probability
Page 1 | Sampling data (MA)
Page 2 | Recording and representing data
Page 3 | Mean median range and mode
Page 4 | Standard deviation
Unit 4 | Calculus
Mode, Median, Mean & Range
When analysing data, there are lots of things that you can have a look at.
The mode is the most common value to come up in the data (think that Mode and Most common both start the same way).The mode can be used for data about numbers and items.
- Example 1:This is a chart of the favourite foods of the all the children in a class
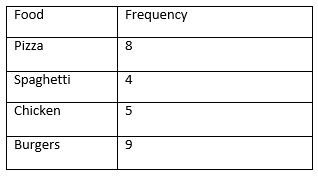 Burgers has the highest number of votes so it is the most common favourite food. This will make it our mode. The mean is found when you add up all the values and divide by how many there are. It can only be used with data that is numerical.
Example 2:
Let’s find the mean height of three friends. Laura is 130cm tall, Jeanna is 126 cm tall and Iman is 132 cm tall.
130 + 122 + 132 = 384cm
We now divide this by three (there were three friends)
384 ÷ 3 = 128
128cm is our mean.
The median value is found by ordering ALL of the values you have from largest to smallest and thenfinding the middle number.
If there is an even number of values, the median is halfway between the two middle numbers.
Example 3:
Let’s find the median of these test results of ten children in Year 3.
![]()
- First we have to put them in order.
![]()
2. We can cross off one number from each end until there are only one or two numbers left.
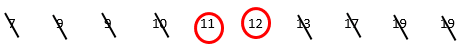
- Since there are two numbers left, the median is halfway between them.
The median is 11.5 or 11 ½ .
Find the range of a set of data is very simple. All you do to find it is take the largest value and subtract the smallest value from it.
Example 4:
We’ll find the range of the test results we used in the last example.
![]()
The largest number is 19 and the smallest is 7.
![]()
Therefore, our range is 12.
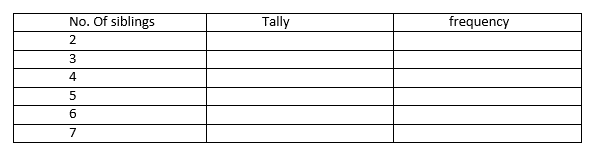
1) Many wants to know how many siblings the people in her class have. These were her results,
2,6,2,3,4,5,7,2,2,3,4,4,5,2,3,7
a) Record her resultsin the tally chart
 b) What is the mode?
c)What is the range?
d) Write of the number in order from smallest to largest.
e) What is the medium?
2) Miss gold gives out gold stars every time a student’s homework has full marks.At the end of the year,these are how many gold stars each student had
Adam 12 Anjali 17 Molly 13
Jeanne 14 bobby 15 Charlie 9
Helena 9 Anna 10 Jason 11
What is the mean score?
The next year, these are the number of gold star for the same students
Adam 9 Anjali 16 Molly 14
Jeanne 15 Bobby 12 Charlie 4
Helena 7 Anna 9 Jason 7
What is the new mean score?![]()
3) The mean of three number is 5 and the mode is 7 .
Write down the three number ?